Piko
Piko Explore prompt ↗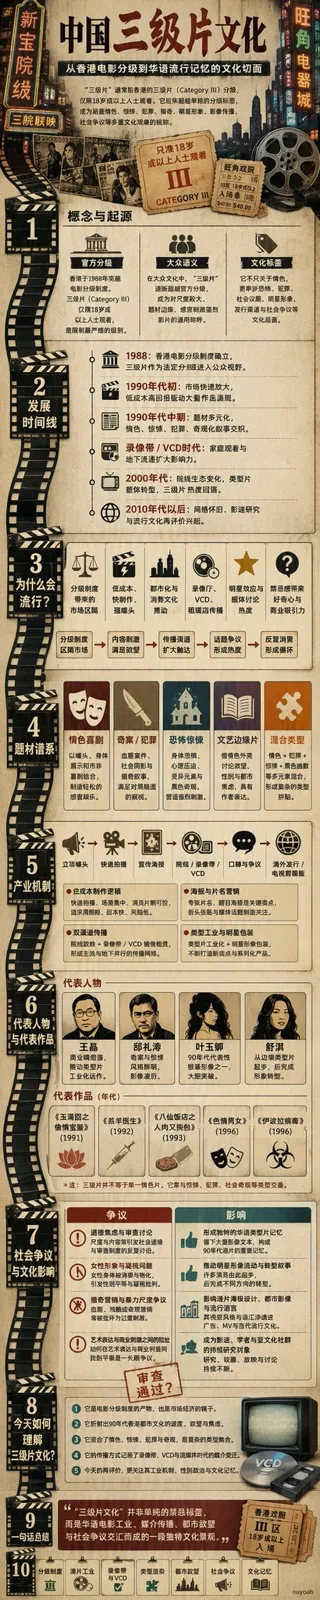
ChatGPT
PhotographyChatGPT
Ai automatic ultra long infographic generator
Creator @nanyuan0412
Prompt
Please automatically create an ultra-long infographic based on the topic input by the user.

This is not an ordinary image generation task. Please treat this task as a complete long infographic production project, automatically completed in this round of tasks: data understanding / web verification when necessary / information architecture planning / master canvas design / segmented continuous generation / seamless stitching / error checking / final export.

Do not simply compress extreme ratios into ordinary vertical images, and do not just generate a single short image pretending to be a long image. Do not show intermediate processes, drafts, segmented images, or analysis processes; only return the final complete product.

【User Input Variables】
Topic: {topic}
Final Width: {width}
Final Height: {height}
Final Aspect Ratio: {aspect_ratio}
Visual Style: {style}
Information Density: {density}
Output Language: {language}
Web Access: {web_mode}
Text Generation Mode: {text_mode}
Color Palette: {palette}
Main Visual Anchor: {visual_anchor}
Output Format: {format}

【Automatic Processing Rules】
1. Automatically determine the category the topic belongs to, such as: History / Technology / Business / Geography / Tutorial / Figure / Culture / Product / Industry Analysis / Trend Summary.
2. Automatically design the most suitable information structure according to the topic type, without using rigid templates.
3. If the topic depends on real facts, timelines, data, development history, phase divisions, representative figures, real cases, or the latest information, automatically verify on the web and extract key information.
4. If the topic is conceptual, aesthetic, knowledge organization, or non-time-sensitive content, the structural design can be completed directly based on existing knowledge.
5. Automatically generate a main visual anchor matching the topic, such as: rivers, paths, timelines, energy lines, knowledge trees, map veins, city roads, star maps, process flows, product chains, etc., and make it run through the entire long infographic.

【Content Structure Requirements】
Automatically generate a reasonable information structure based on the topic. Include at least:
- Main Title
- Subtitle / Introduction
- 4 to 10 main sections
- Key points under each section
- Representative visual elements
- Bottom summary / Enlightenment / Conclusion / Method checklist

If the topic is History, it should prioritizedly include:
Origins, stage evolution, key events, representative figures, systems / civilizations / cultures, impacts and summaries.

If the topic is Technology, it should prioritizedly include:
Definition, core principles, development stages, key technologies, representative companies / products, application scenarios, trends and challenges.

If the topic is Business / Brand, it should prioritizedly include:
Origins, development nodes, product / service systems, business models, user personas, competitive landscape, key data, trend summaries.

If the topic is Tutorial / Methodology, it should prioritizedly include:
Conceptual definition, steps/processes, core methods, precautions, common mistakes, tool checklists, case descriptions, summary suggestions.

【Text Strategy】
All titles, section names, body descriptions, labels, years, numbers, quotes, and summary texts should prioritizedly be generated directly by the image model and integrated into the overall image to form an AI-native integrated infographic effect.
Text must be real and readable, and must not use garbled characters, fake Chinese characters, or meaningless placeholders.
When there are obvious typos, incorrect orders, factual errors, year errors, duplicate paragraphs, or layout breakdowns, partial corrections of the problem areas are allowed, but the final style must remain unified, without a post-pasted disjointed feel.

【Visual Style Requirements】
The entire image must maintain a unified:
- Color system
- Paper / Background / Texture logic
- Margin system
- Title font temperament
- Body font size sense
- Icon system
- Illustration language
- Layout density
- Information hierarchy

The default style is high-density, clear structure, visual unity, and detail-rich AI-native infographic.
Avoid ordinary PPT feel, template collage feel, cheap marketing poster feel, messy layout, and obvious paragraph fragmentation.

【Long Infographic Production Rules】
1. First establish the final master canvas, with dimensions of {width} × {height}.
2. Automatically split continuous segments according to the final height; it is recommended that each segment's effective generation height is about 1000–1400 pixels.
3. The number of segments is automatically calculated, which can be estimated by ceil({height} / 1100).
4. Adjacent segments retain 15%–20% content overlap.
5. Each segment must inherit the visual anchor, margins, hue, texture, text temperament, structural density, and composition logic of the end of the previous segment.
6. It is not allowed to restart design for each segment; it must extend naturally like the same long infographic.
7. If content duplication, connection breakage, text distortion, or image breakdown occurs in the first generation of a certain segment, it will be automatically corrected before being included in the final stitching.

【Seamless Stitching Rules】
1. Automatically identify overlapping areas.
2. Automatically crop duplicate content.
3. Automatically perform vertical position alignment.
4. Automatically match paper texture, ink color, brightness, contrast, color temperature, and border style.
5. Use edge feathering, local repair, structural continuation, etc., to eliminate stitching marks.
6. Ensure that the main visual anchor, timeline, path, mountains, city skyline, flow line, or decorative patterns remain continuous.

【Final Check】
Automatically check and correct the following issues:
- Typos, garbled characters, fake characters
- Data errors or logical errors
- Chronological order errors
- Confusing title hierarchy
- Module duplication
- Obvious seams
- Main visual anchor breakage
- Style inconsistency between upper and lower segments
- Bottom content truncated
- Imbalance of white space
- Missing signature

【Final Output】
Only return 1 final complete long infographic.
Format: {format}
Dimensions: {width} × {height}
Ratio: {aspect_ratio}
Add an unobtrusive artistic signature "nuyoah" in the bottom right corner.
Do not return intermediate segments, do not return process descriptions, do not use short images to pretend to be long images.
Copy the text, add your own details, and try it in your image model.